Why should you invest over the long term, and how?
Whether you’re preparing for retirement, financing future endeavours or creating an estate to pass on to your loved ones, there are many reasons to build up financial capital. Whatever your goal, investing on financial markets is an attractive alternative to traditional savings schemes, and could well be more profitable. However, instead of trying to land the investment of a lifetime, myLIFE explains why it is probably better to invest small amounts regularly over a long-term investment horizon.
Before we get into long-term investments, we’d like to emphasise the importance of stepping back and reflecting before making any financial decisions. Even before contacting an expert to help you define your investment horizon and draw up your investor profile, make sure you’re not likely to need the money you want to invest for quite some time. Ask yourself the following questions:
- How much can I afford to put aside per month?
- Do I have any medium-term projects that I need to bear in mind?
- Do I have sufficient liquidity in addition to my investments to get me out of any tough spots?
The next step is to think about your long-term investment goals and what risks you are willing to take to achieve them. This will determine the type of investment and the horizon that best fit your situation. Diversifying your investments is another way to further reduce risk – though this does diverge slightly from the original purpose of this article.
[…] a long-term outlook exposes you to a little more risk, meaning you can expect better yield prospects than with guaranteed investments.
Why invest over the long term?
The obvious answer is to achieve better returns! This is not only because you have time on your side, but also because a long-term outlook exposes you to a little more risk, meaning you can expect better yield prospects than with guaranteed investments. A long-term investment strategy means that, in principle, you can ride out the rough patches, since there is enough time to recoup any losses sustained. Just accept that there will be difficult times. The long-term investment strategy generally pays off, but it’s not all plain sailing – you need nerves of steel and the courage to stick to your guns during turbulent periods.
Another benefit of investing long-term is the flexibility in the investment vehicles available to you, which can help you boost profitability. Between investment fund savings plans (SICAVs) and unit-linked retirement savings plans, the resources available to you are much more diversified and have the potential for greater returns compared to a traditional, risk-free savings account. While past performance is not a reliable indicator of future results, if you look back on the performance of these riskier investments, you’ll see attractive long-term profitability despite temporary periods of decline. And this is without even mentioning the potential tax benefits some of these solutions can bring!
Why invest regularly rather than all at once?
One very important factor when it comes to investing is market timing, i.e. at which moment you choose to enter or exit the market. Timing can make all the difference, even for long-term investments.
Unfortunately, many savers start by investing a large portion of their savings in one go, with no sense of the risk involved in timing. You can hit the jackpot if you invest at the right time, but you can also incur significant losses if you jump in just before a market turnaround.
Example
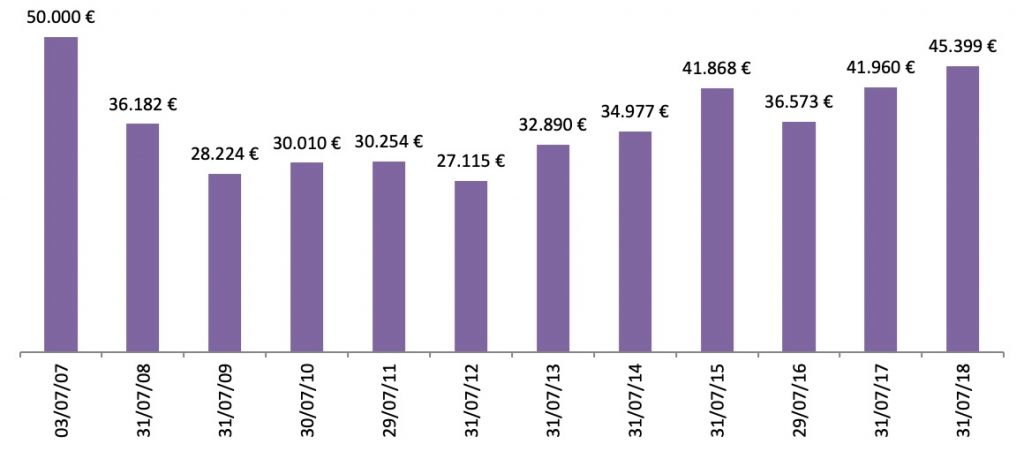
Two investors, positioned on a tracker replicating the performance of the CAC 40 index, decide to sell their shares on 31 July 2018 (closing price: €5,511.30). Investor A invested €50,000 on 3 July 2007 (CAC 40 closing price: €6,069.84), unaware of the subprime crisis that would occur one year later. Investor B waited until the worst had passed and invested €50,000 on 24 March 2009 (CAC 40 closing price: €2,874.39).
Investor A received €45,399 after 11 years, which translates to a loss of almost 10%, while investor B gained nearly 92% and ended up with €95,869 after 9 years. Investors A and B both had the same investment strategy, but their respective timings led to very different outcomes. Investor B timed it well and almost doubled their initial investment. However, investor A timed it so poorly that they ended up in negative territory despite a long-term strategy. This can be seen in Graph 1.
Graph 1 – Lump-sum investment strategy (€50,000)

Graph 1 legend: evolution over time of a single investment of €50,000 made on 3 July 2007 on a tracker replicating the performance of the CAC 40 index, until the shares were sold on 31 July 2018. This graph shows how the investment performed based solely on changes in the CAC 40 index price (CAC 40 price, Euronext Paris stock exchange listing), independent of any charges or fees that may be linked to this investment. This graph is for illustration purposes only and does not constitute an offer to sell.
[…] there is a very simple strategy to help mitigate the impact of bear markets while taking advantage of upside phases: investing regularly in small amounts.
Perfectly mastering market timing can help you be more like investor B, but this is famously difficult even for the world’s leading experts. Fortunately, there is a very simple strategy to help mitigate the impact of bear markets while taking advantage of upside phases. All you have to do is invest regularly in small amounts rather than risk investing large sums of money at the worst possible moment and suffering from market downturns.
Investing regularly (e.g. €100 every month) effectively reduces risk, and means you don’t need to fret about getting the timing right. In a bull market, all your current investments benefit from the upswing. In a bear market, the securities you hold do lose value, but you can also purchase new ones at a reduced unit price.
We hope you now understand that, combined with a long-term investment outlook, regular instalments allow you to control risk while still generating significantly higher returns than conventional savings schemes or guaranteed investments.
Example (continued)
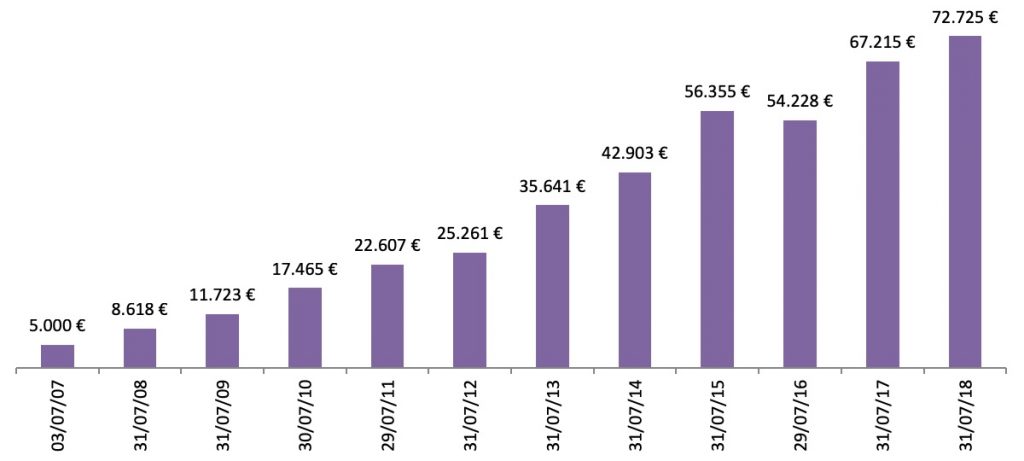
Let’s take another look at investor A and imagine that, instead of investing €50,000 once in 2007, they invested €5,000 at the end of July every year for 10 years. In this scenario, investor A suffered heavy losses only on the first €10,000 until the worst of the crisis passed in 2009. This means that 80% of the total amount was not impacted by this particularly rocky period. They may have not fared as well as investor B when they sold their shares on 31 July 2018, but they still ended up with €72,725 – making a 45.5% gain instead of a 10% loss (see Graph 2).
Graph 2 – Cumulative annual investment strategy
(investment of €5,000 once a year for 10 years)

Graph 2 legend: evolution over time of a €5,000 investment made in July every year for 10 years (see the graph for exact dates) on a tracker replicating the performance of the CAC 40 index, until the accumulated shares were sold on 31 July 2018. This graph shows how the investment performed based solely on changes in the CAC 40 index price (CAC 40 price, Euronext Paris stock exchange listing), independent of any charges or fees that may be linked to this investment. This graph is for illustration purposes only and does not constitute an offer to sell.
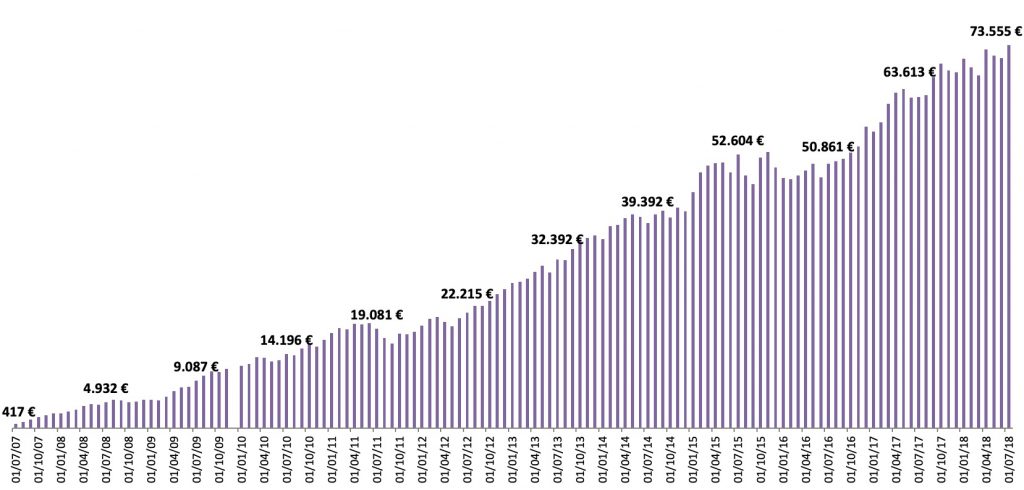
Following the same logic, investor A would have been better off investing €416.70 every month instead of making one €5,000 investment each July. As shown in Graph 3, they would have received €73,555 on 31 July 2018, a gain of 47.1%.
Graph 3 – Cumulative monthly investment strategy
(investment of €416.70/month for 120 months)

Graph 3 legend: evolution of an investment of €416.70 a month for 120 months, starting on July 2007, on a tracker replicating the performance of the CAC 40 index, until the accumulated shares were sold on 31 July 2018. This graph shows how the investment performed based solely on changes in the CAC 40 index price (CAC 40 price, Euronext Paris stock exchange listing), independent of any charges or fees that may be linked to this investment. This graph is for illustration purposes only and does not constitute an offer to sell.
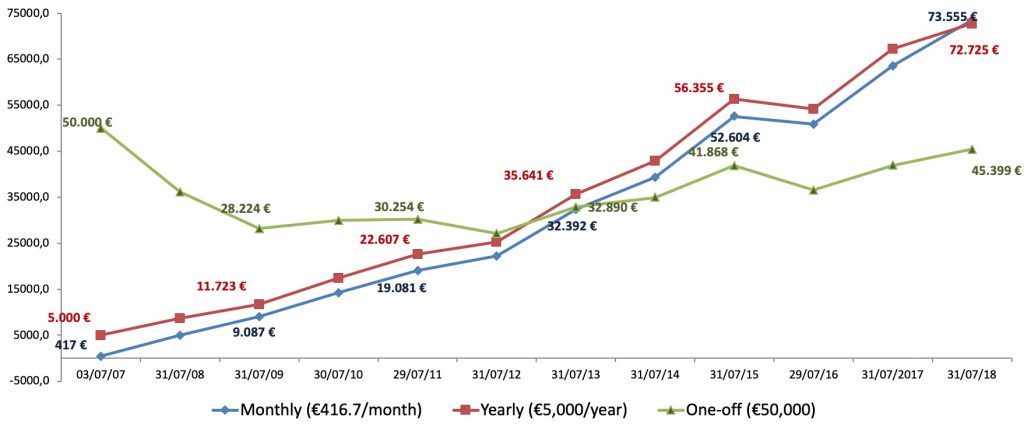
Graph 4 below compares the three long-term investment strategies shown in the previous graphs.
Graph 4 – Summary of the investment strategies

Graph 4 legend: comparison of Graphs 1, 2 and 3 showing different investment strategies on a tracker replicating the performance of the CAC 40 index between 3 July 2007 and 31 July 2018. This graph shows how the investment strategies performed based solely on changes in the CAC 40 index price (CAC 40 price, Euronext Paris stock exchange listing), independent of any charges or fees that may be linked to these investments. This graph is for illustration purposes only and does not constitute an offer to sell.
We’ll let you decide whether the better yield prospects are worth the risks involved, and don’t forget that past performance is not a reliable indicator of future results. As our final piece of advice, we would like to stress the importance of seeking help from a professional, especially if you are taking your first steps into the world of investment. Good luck!


 Mortgage
 Personal loan
 Savings